Sunny prospects
Good solar forecasts create significant added value. They optimize sales for photovoltaic assets, which leads to lower balancing and control reserve costs. Complicated algorithms working in the background ensure that the forecasts are as accurate as possible. They process large volumes of data from multiple sources so traders are well-positioned on the market.

Forecasting solar energy is important for power trading. The forecasts inform the decisions made by power traders, which in turn impacts profit for asset operators and marketers. Additionally, the available amount of solar power influences larger trends in the market, making a good forecast relevant beyond the solar power trades themselves.
Power from most photovoltaic assets (PV assets) is currently traded on an exchange using the market premium model – often through a direct marketer such as Next Kraftwerke. Asset operators earn profits from the trade and the market premium. They also receive a management premium, which is added to the market premium for new assets. Usually, a marketer receives a portion of the management premium for marketing services. This is where the forecast is important: The better it is, the better traders can market the portfolio, leading to lower balancing costs and more residual marketing and management premiums for operators and marketers. A good forecast is therefore essential for a successful market.
More data leads to a better forecast
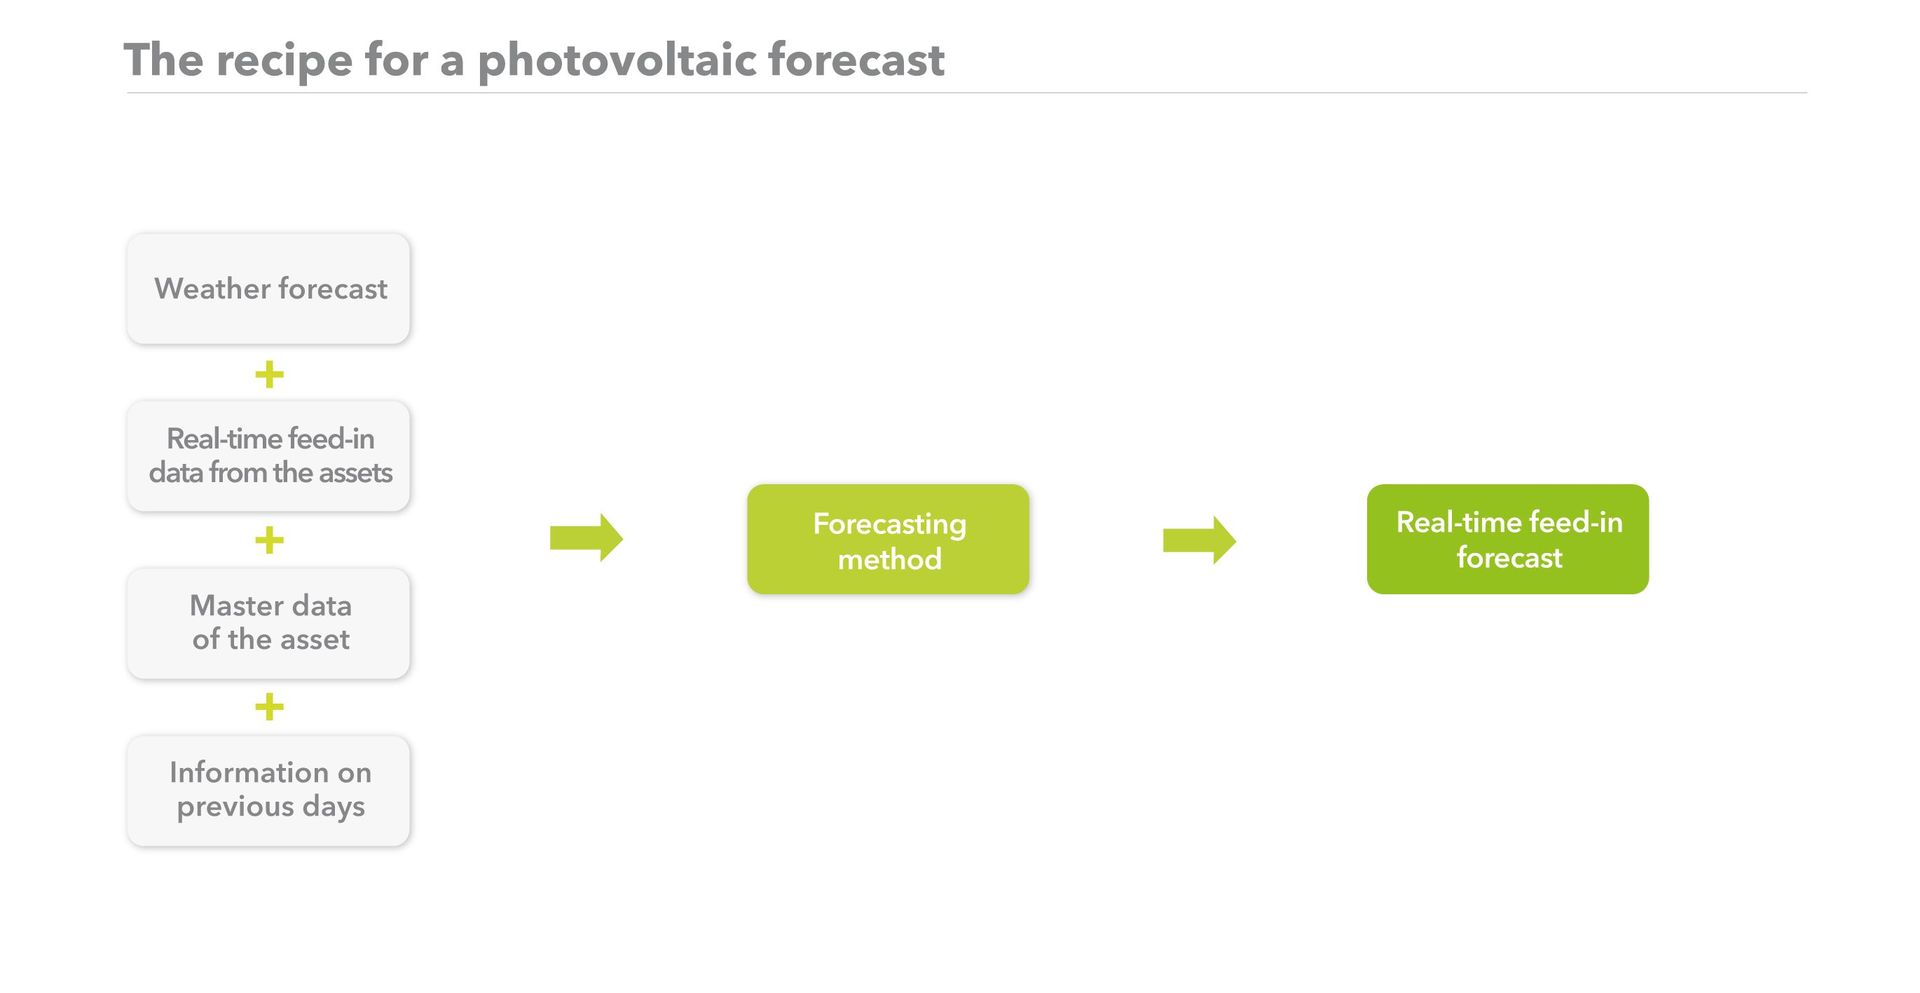
To create a forecast that is as accurate as possible, analysts look beyond the weather report. In fact, they use a wide range of data to predict a pattern of PV feed-in that is as precise as possible. The underlying idea is that if more data is available, the pattern becomes more precise.
Plant operation schedules, consumption and feed-in measurements, prices and ordered volumes on power exchanges, weather data, geographic data – all are examples of data that is incorporated into the forecast. The data comes from several different sources, is measured at different times, and utilizes different formats and data types. The large volume of data is processed by an algorithm and turned into a forecast of PV-power feed-in volume.
Forecast algorithms are mathematical processes, assisted by parametric models and machine learning, that analyze sets of data and report the results. Parametric models are based on statistics and use current data and a series of estimates to arrive at a conclusion about the future – daily PV feed-in, in this case. Machine learning, on the other hand, involves a data analyst using ‘lessons’ to teach a computer to recognize certain patterns within the data and to predict further developments. With PV forecasting, this includes the typical shape of the feed-in curve of PV power over the course of a day. As the volume of data provided to the computer grows and becomes more structured, the better the computer becomes at creating a corresponding pattern, which can include the ability to recognize deviations to the norm. This principle can apply to all forecasts that are being created today. The difference lies in the sources of data that are used and how the algorithm has been written, which varies from provider to provider.
Based on real-time data
Currently at Next Kraftwerke, solar power makes up almost 50 percent of the portfolio. That's around 3,000 megawatts (updated 6/2019). Using our Virtual Power Plant, we market this power in auctions on the day-ahead market and balance out any fluctuation with intraday trades. On intraday markets, power is continuously bought and sold for delivery on the same day, making these markets a useful tool to balance volatile PV power on short notice. In Germany, a position can be traded up to 5 minutes prior to delivery, making very quick adjustments to power volumes possible to keep balancing costs low.
At Next Kraftwerke, real-time data from our PV assets across Europe are among the sources we use to create our forecasts. The data is delivered from the PV assets using our Next Box remote control unit or through other interfaces such as the data logging APIs in the asset’s inverter. Using these various interfaces, we receive data in real time and are continuously informed about the feed-in from all 1,100 assets in our Virtual Power Plant. However, this data on its own is not enough for an accurate forecast. To make the forecast as precise as possible, we supplement the real-time data with geographic data from the assets and information pertaining to previous days, such as older feed-in data from the PV assets.

Finally, weather predictions from multiple sources – such as data on cloud development – are incorporated into the equation for our solar forecast. The variety of data from diverse sources and time periods improves the forecast, helping to create a precise feed-in pattern. Anyone familiar with this pattern can use it to make forecasts and predict how much power can be delivered at a certain time in the future.
Algorithm team work
To process such a large amount of complex, poorly-structured high-frequency data, we created an algorithm that is tailored exactly to our needs. We began several years ago with simple scripts. Today, we have a sophisticated algorithm that collects and processes data from many assets in several countries. The IT department, traders, and analysts work closely together to improve the algorithm using each department’s unique expertise.
It only takes seconds to process and calculate the data, thanks to our IT team. Saving, processing, checking, and correcting the data when needed – the IT department makes sure that this complex process goes off without a hitch. This is important because it is the only way for our forecasts to stay ahead of the market and for our traders to balance out deviations from the forecast at a better price.
Forecasting in two steps
Our evaluation of the data for the PV forecast is conducted in two steps. The data is first converted to a unified standard format so it can be accessed by the algorithm. Next, the algorithm checks if the data makes sense – perhaps an asset had gone offline, causing distorted measurements. This is known as a plausibility assessment. If something doesn’t add up, we take a closer look to see if the deviation has an explanation.
In the next step, the formula sorts the assets into groups which creates a portfolio effect. If a particular asset does not perform as expected in a group, the other assets can cover the difference. This reduces forecasting errors because the profile of a group is less volatile than the profile of a single asset. Once the assets have been grouped, all other data such as weather indicators and the current feed-in of each asset is added to the mix and the algorithm creates the forecast.

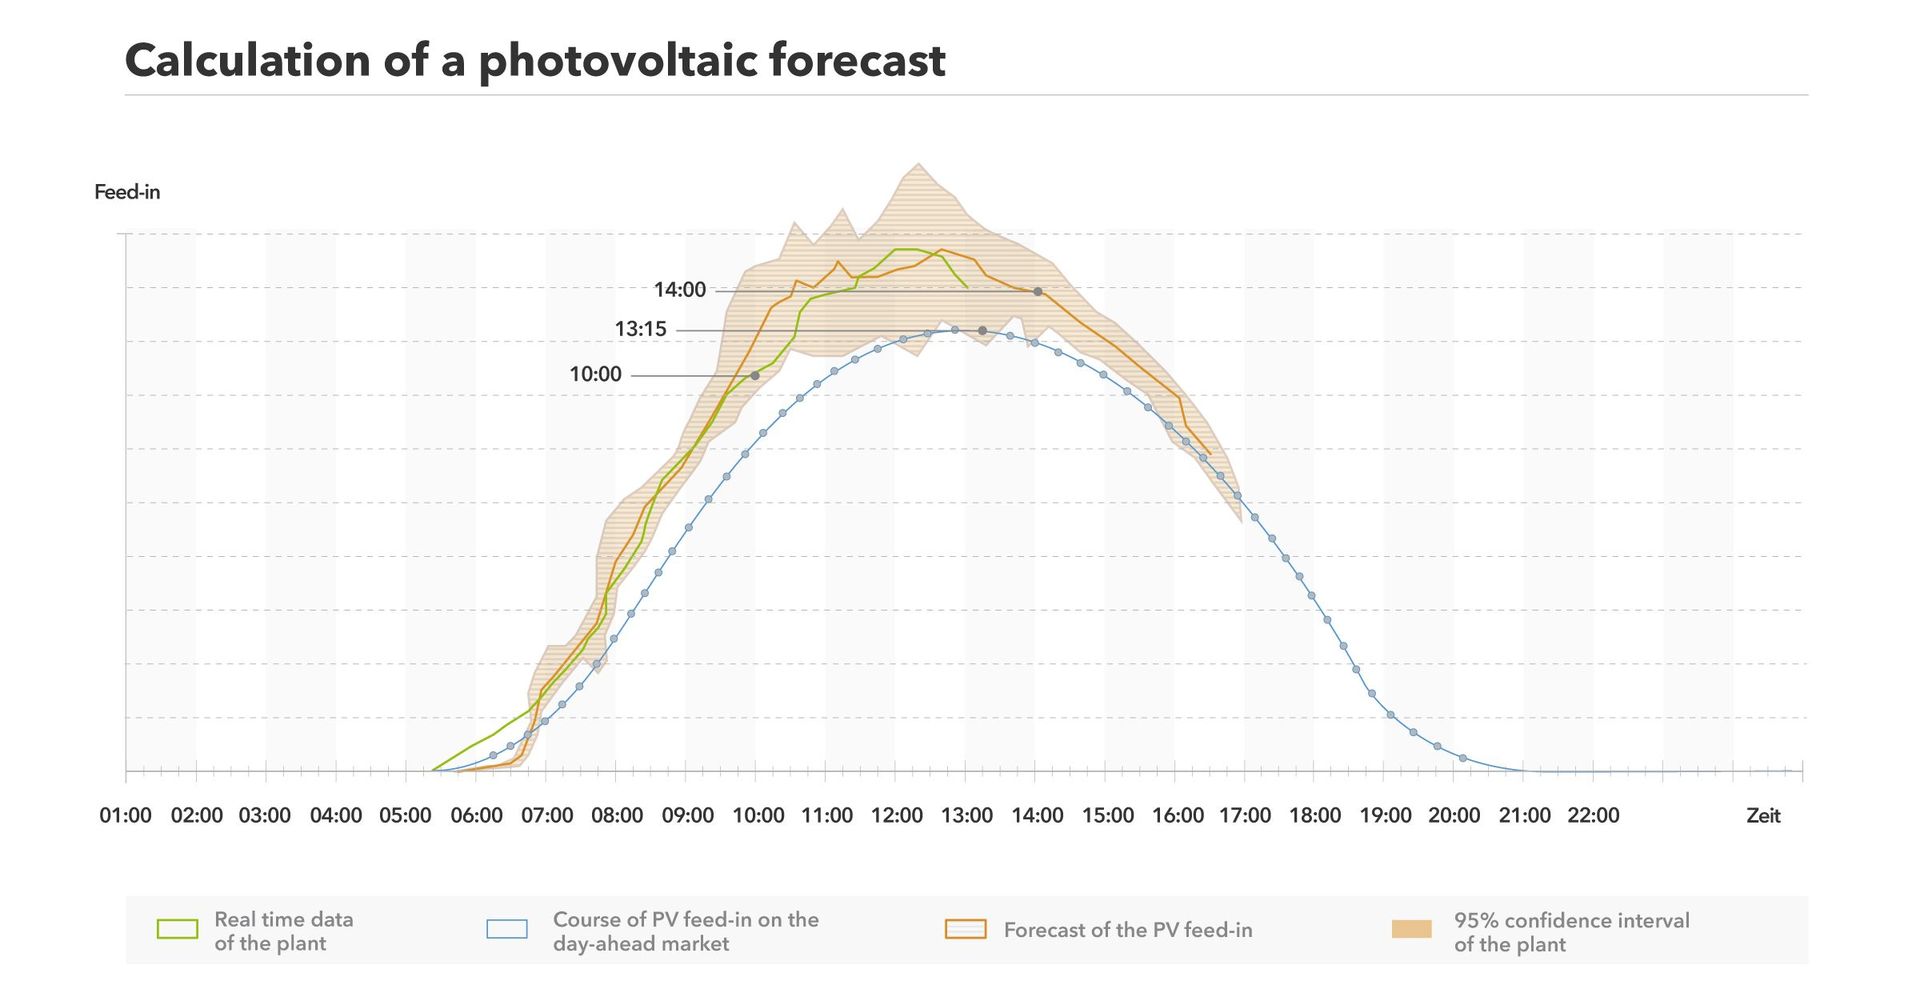
Live feed-in data from the assets makes it possible to continually adjust and refine the forecast. Our initial forecast is calculated a few hours in advance. It is then regularly checked and updated. As we approach the scheduled delivery time, the forecast becomes more precise. While maintaining current forecasts is the main benefit, we have the additional benefit of a check conducted every few minutes that confirms the assets are working properly.
The algorithm calculates an updated forecast every five minutes, meaning the entire process of processing and calculating the data starts from the beginning with current data. With each update, traders learn how much PV power is available to be traded and conduct trades based on the difference to the previous forecast. For example: At 2 p.m., we forecast a feed-in volume of 100 megawatts for the quarter-hour interval between 3 and 3:15 p.m. At 2:30 p.m., the forecast is updated and indicates a volume of 120 megawatts. This means the brokers have an additional 20 MW to sell on the intraday market.
With real-time data coming in from the assets using various interfaces, we can quickly examine our forecasts to see if they are good. This means, for example, that we run a plausibility check of our 11:30 forecast at noon. If the forecast was not accurate, we can quickly react and adjust for future trades.
More to read
PV forecasting creates added value
The benefit of PV forecasting is not limited to marketing the solar assets. Forecasted volumes of available PV power also influence the amount of power that needs to be delivered from other power producers to ensure that total demand is met. Prices sink when the sun is shining, but rise as clouds roll in. Inaccurate forecasts also lead to rising control reserve costs to balance out unexpected fluctuation in the power grid.
A good PV forecast is therefore more than just a prediction about the volume of solar power. It creates added value for the entire energy system and is an important indicator of larger developments on the market.
The article was first published in e|m|w 4|2018. Go to Website


