SAIDI – when the lights (don’t) go out
More renewable energy means less grid stability – this concern is often repeated by critics of renewable energy. But how is the stability of the grid actually measured?
It can be done with the SAIDI. The System Average Interruption Duration Index calculates annual power interruption. It is compiled using the time, duration, extent, and cause of a supply disruption, providing the average duration in minutes of a supply disruption per connected end consumer. A power outage can be caused by many different reasons. For example, natural disasters and the general influence of the weather can lead to interruptions in supply.
Power outages caused by natural disasters and weather are increasing, according to Germany’s Federal Office of Civil Protection and Disaster Assistance, but are not included in the calculations for the SAIDI. Technical failure and human error are further potential causes of a power outage. These would include interruptions that can be traced back to the operator, the influence of third-parties, or other grid problems. Interruptions like these are included in calculating the index, provided they last longer than three minutes. A country comparison conducted by the Council of European Energy Regulators (CEER) revealed the following findings for 2013* :
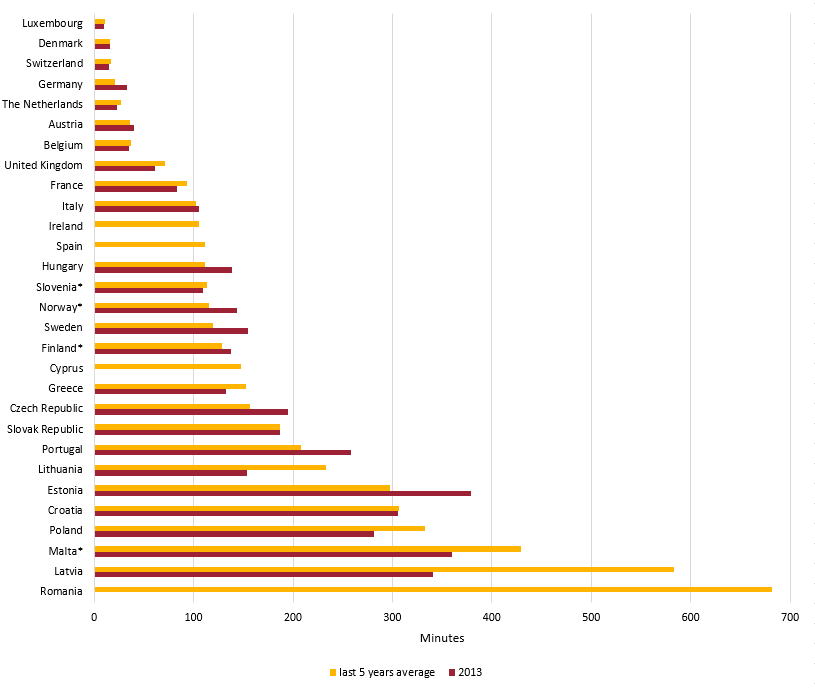
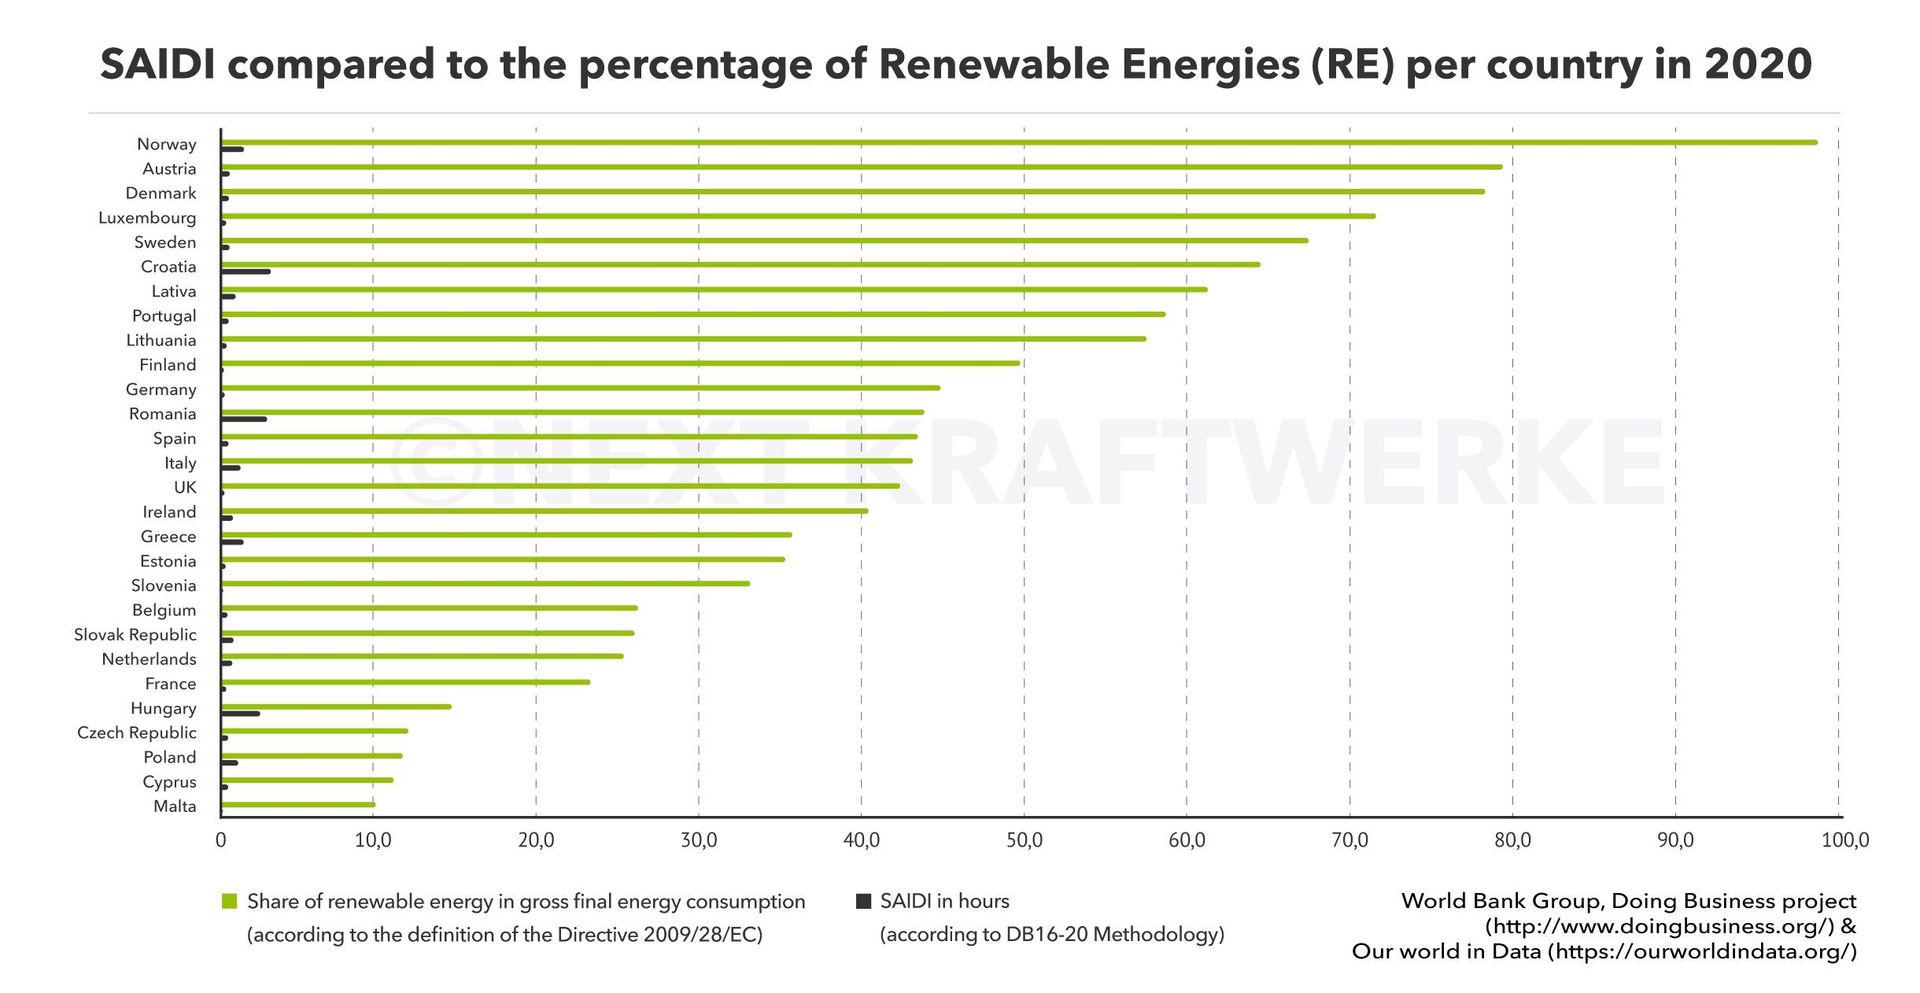
Interesting to note is that the top positions – with the exception of number one Luxembourg – are represented by countries that already have a high proportion of renewables in their energy mix. So let's compare the SAIDI with the percentage of renewable energies on the grid in different European countries :
Let’s take a look at Germany. The proportion of renewable energies in Germany has constantly increased in recent years - and the average duration of supply interruptions has subsequently gone down.
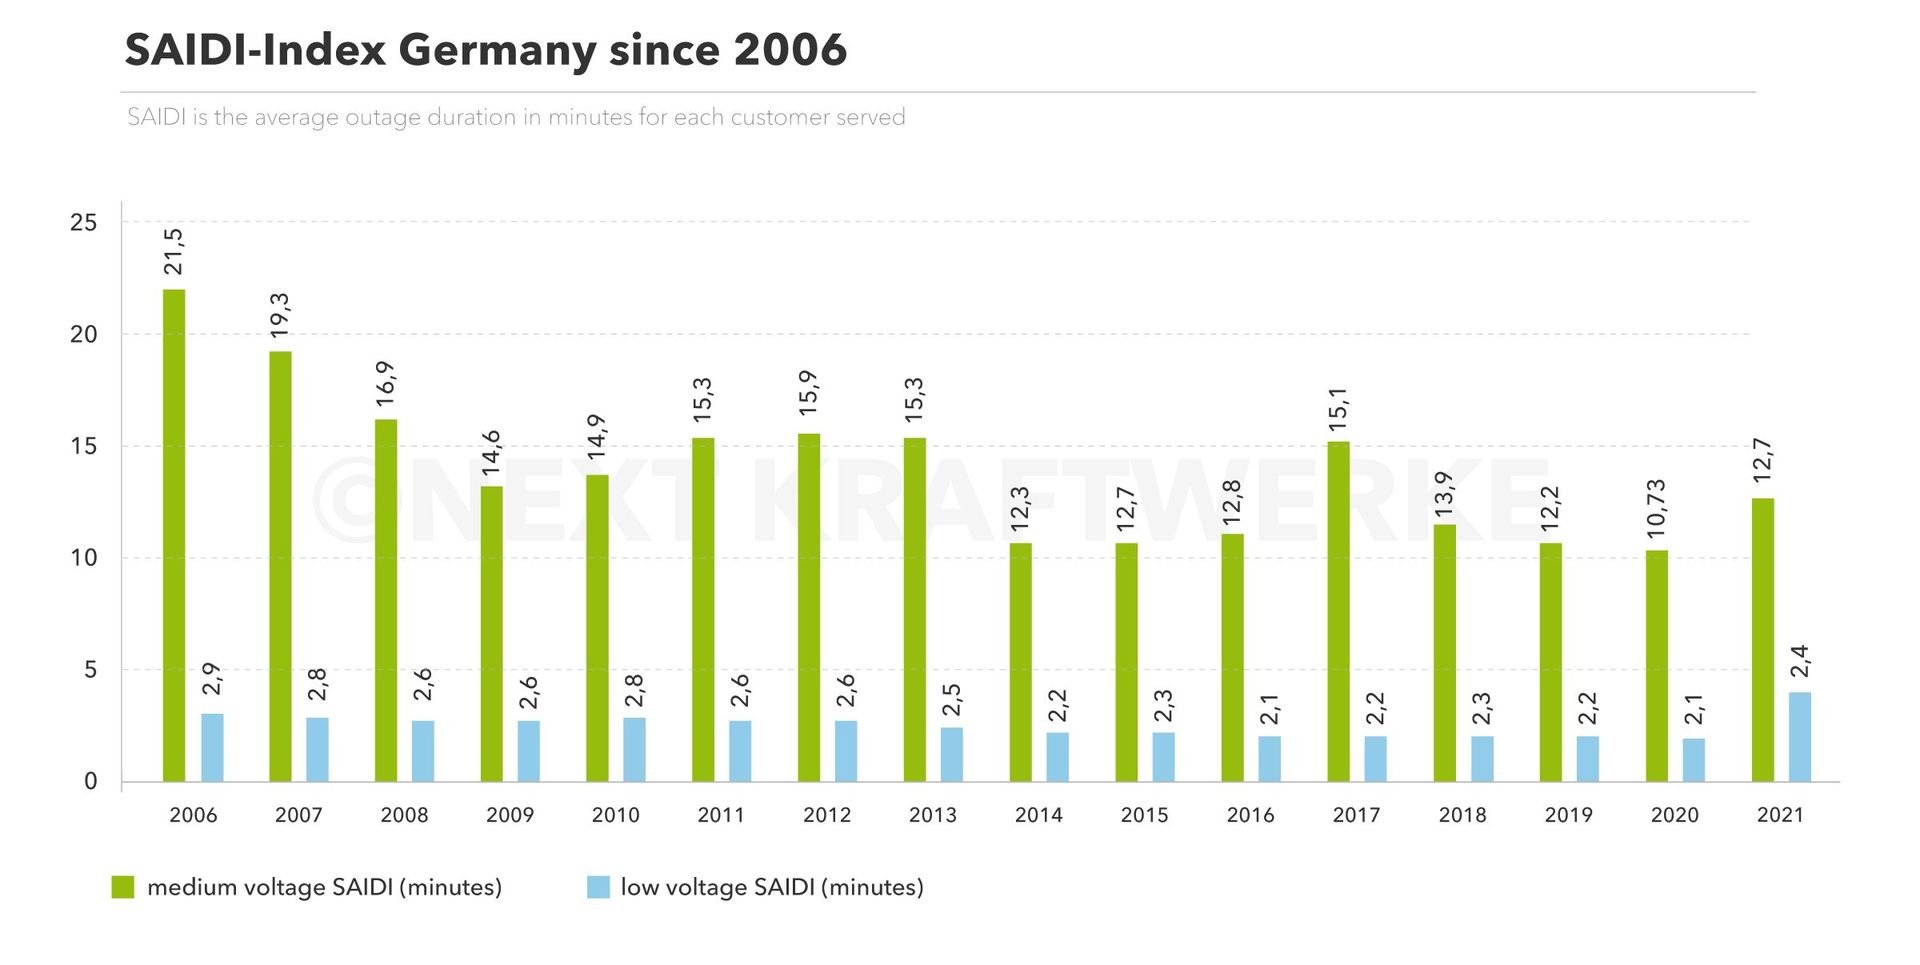
The proportion of renewables in the German energy mix is growing, and the proportion of volatile inputs such as solar and wind plants along with it. A country like Germany in the midst of an energy transition can therefore counter the argument that renewable energies create instability in the grid by referring to a trend in recent years that shows the opposite: the duration of supply interruptions is declining; Germany’s value on the SAIDI is much lower today than it was in 2006. The idea that “more renewables mean more power outages” therefore misses the mark.
More to read
*"A questionnaire was sent to CEER Member and Observer countries; 24 countries responded. Participation in this exercise has significantly increased since CEER’s 1st Benchmarking Report in 2001.
It is important to emphasise that indicators for CoS are currently not perfectly harmonised between different countries. Definitions of the indicators described in this report can be found in the 4th CEER Benchmarking Report. In particular, the following definitions might differ depending on the country:
- The voltage levels EHV, HV, MV and LV;
- Exceptional events;
- Indicators such as SAIDI, SAIFI, MAIFI, AIT, ENS can be calculated with slightly different methods depending on the country (for example due to national legislation);
- The distinction between rural, semi-urban and urban areas."
- Photo Credit: Spiros Vathis, License: CC BY-ND 2.0
More information and services
